
The growth of the hemp-derived cannabinoid market, including THC beverages and THC edibles faces a significant obstacle, and it's not what you might think.
It's not about legality, inherent risks, or even market demand. The real challenge lies in the shadows of the unknown—specifically, a fragmented landscape of critical data. This data isn't missing; it's just scattered across a myriad of sources, making it nearly impossible to piece together a complete picture.
Imagine the Herculean task of gathering concrete data on hemp-derived THC products. These products are everywhere—sold in gas stations, spas, dispensaries, liquor stores, barbershops, chiropractic offices, convenience stores, and through countless ecommerce platforms.
The diversity of these selling points is only matched by the variability in their data tracking methods, which differ from one business to the next.
Even if every retailer and brand wanted to pool their data together, we don't have a centralized repository or a team dedicated to transforming this disparate data into a cohesive whole, yet. We're missing both a standardized data collection framework and an entity to convert raw data into actionable insights.
This absence of a unified data platform leaves us guessing about the market's true dimensions and the relative market shares of different product categories, like hemp-derived THC edibles versus THC-infused beverages.
While there have been commendable efforts to bridge this knowledge gap—kudos to initiatives like the Whitney Economics report—the journey to a thorough understanding of the market's nuances is still early.
Additionally, it isn't for a lack of trying. The team at Delta Emerald Ventures has made a significant push to better understand this market, by putting on conferences like CannaDataCon and uniting the minds who can help crack this problem.
Organizations like Hemp Beverage Alliance and Cannabis Beverage Association have also given a forum for brands and retailers to help work on this challenge.
With a clearer view of the hemp-derived cannabinoid market, we can begin to demystify the unknown, providing insights not just for our own business decisions but also for legislators, insurers, investors, sports franchises, corporate partners, banks, and more. These stakeholders are crucial in unlocking the market's full growth potential.
So, how do we kickstart this journey towards unifying these hemp data sources?
By setting an example with our own data.
We hypothesize that by showcasing the power of data analysis, we can encourage others to contribute their pieces to the puzzle, collectively moving towards a comprehensive understanding of this vibrant market.
Our exploration begins at the macro level, analyzing product categories, before zooming in on the minutiae of individual products, brands, and their unique stories. But first, let's get acquainted with the dataset that forms the backbone of our analysis.
THC Edibles and Beverages Data Set Background
This data stems from Hemp House Shopify data for 2023. Hemp House is a chain of Hemp Dispensaries in Minnesota with 3 physical locations and an online store. Hemp House sells nearly 700 SKUs of Delta-9, hemp-derived THC products including edibles, beverages, and beverage enhancers.
This data looks at units sold and orders but this data doesn't include revenue broken down by month. This data set is for roughly 86,324 orders and 198,266 units of sales.
High-Level Analysis
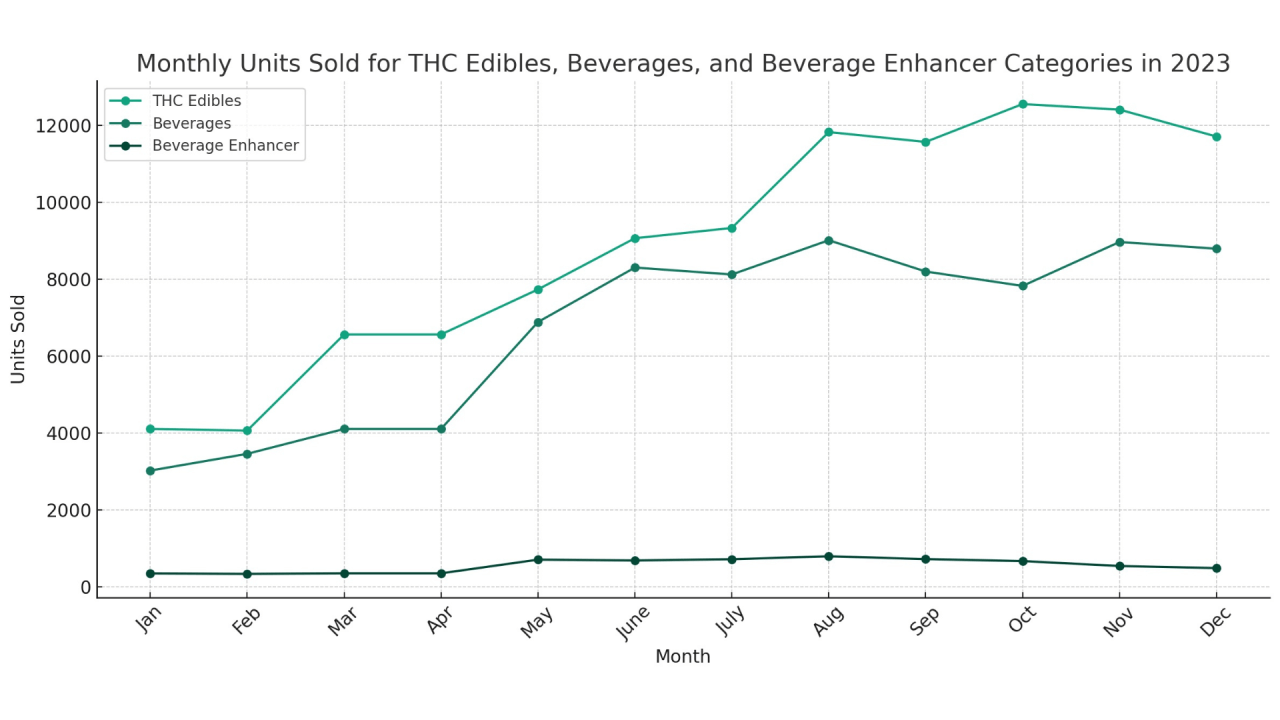
Before diving into the graphs above, we’ll first want to make some callouts. Specifically, high growth in April due to the 4/20 Holiday season, an uptick in August due to Minnesota legalizing both hemp-derived beverage sales in liquor stores and recreational cannabis, and Green Wednesday/Black Friday/Cyber Monday in November.
With that context, let’s dive in.


What do you notice?
There is a strong correlation between THC edible units sold and orders. It makes sense, people want options and often order both edibles and drinks in the same order.
However, if we look closely at the graphs, we'll notice a few times where the growth for one category in a given month outpaces the others. For instance, the rise in May suggests that as the summer months approach and the weather changes, people begin to consume more THC beverages.
We notice a tighter delta between beverages and edibles in the summer months until August when the weather starts to cool down.
Here are some additional takeaways:
Consistency in THC Edibles Popularity: Both graphs indicate that THC edibles consistently have a high number of orders and units sold throughout the year. This suggests a steady demand for THC edible products, underscoring their importance as a core focus for retailers and brands. People know and are familiar with edibles.
Beverages as a Strong Second: Beverages maintain a strong position both in terms of units sold and orders, though they generally lag behind THC edibles. This shows a significant consumer interest in cannabis-infused beverages, probably because of their convenience, variety, and possibly the novelty factor.
Beverage Enhancer Niche but Noticeable: The beverage enhancer category shows fewer units sold and orders than THC edibles and beverages, which is expected for a niche category. However, there is a market for enhancing or customizing cannabis beverages, highlighting an area for potential growth.
Order vs. Units Sold Dynamics: The differences in trends between the number of orders and the units sold per order could indicate varying consumer purchasing behaviors across categories. For example, a category with higher units sold but lower orders suggests bulk buying or higher consumption rates per purchase. In contrast, a category with more orders but fewer units per order might indicate more frequent, smaller purchases.
Overall, the trends suggest that while THC edibles remain a dominant category, there's significant interest in alternative consumption methods like beverages and beverage enhancers.
THC Edibles and THC Beverages Yearly Growth

The percent growth for each category from January to December 2023 is as follows:
THC Edibles: Approximately 185.0% growth
THC Beverages: Approximately 190.5% growth
THC Beverage Enhancers: 39.4% growth
These figures indicate significant growth for both edibles and beverages throughout the year, with both experiencing nearly triple their units sold from January to December. The beverage enhancer category also saw growth, albeit at a more moderate rate, which reflects its niche market position compared to the broader appeal of THC edibles and beverages.
THC Beverages and THC Edibles Seasonality

Here are a few observations that might indicate seasonality or certain trends over the year 2023:
Growth Trajectory: Both THC edibles and beverages categories showed substantial growth throughout the year. This indicates a growing consumer interest or market expansion during this period. The sharp increase might suggest that these categories benefit from certain times of the year more than others, possibly influenced by holidays, seasonal changes in consumer behavior, or specific marketing campaigns.
Summer Uptick: Given the nature of the products, particularly beverages and beverage enhancers, there looks to be an uptick in sales during warmer months. Consumers may be more inclined to try beverages as refreshing alternatives during summer, which could explain increases in sales for these categories during those months.
End-of-Year Increases: The significant percent growth observed from January to December for THC edibles and beverages might also suggest an increase in consumer spending towards the end of the year, possibly influenced by holidays, social get-togethers, and gift-giving occasions.
Consistent Demand for THC Edibles: The demand for THC edibles seems robust throughout the year, indicating less seasonality compared to beverages and beverage enhancers. This might be due to the nature of edibles as a versatile, discreet, and easy-to-dose option, appealing to consumers year-round.
In summary, the overall growth patterns suggest that beverages and possibly beverage enhancers have seasonal appeal, with summer months likely driving higher sales. THC edibles maintain strong, possibly less seasonal, demand, highlighting their foundational role in the cannabis products market.
What’s Next
Product categories are a more macro view and easier to analyze. Next, we’ll break this down even further.
How do THC gummy sales compare to chocolates? How do THC seltzers compare to sodas? What dosages do people buy the most of? Which cannabinoid profiles do people gravitate towards? What brands are shoppers buying the most of? The list goes on.
Stay tuned for more, and please reach out if you’re interested in working together to finally unite the data streams this industry desperately needs.
Rising tides lift all boats.


